EEG Controlled Robotic Hand
VIDEO DEMO AT BOTTOM OF PAGE
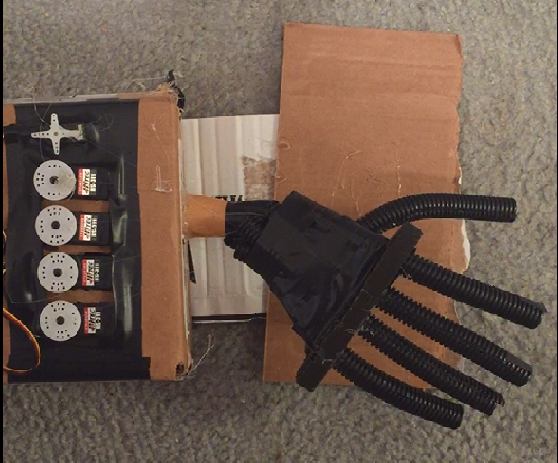
Robotic Hand, controlled by Arduino and 5 servos.
In this project, our goal is to use EEG signals to create interesting and useful real-life applications using machine learning. For our purposes, a mechanical hand was built, which is controlled by EEG signals. Due to the nature of EEG signals, machine learning is a popular choice for accurate classification. The goal of this project was an accurate binary classification of EEG signals based on two potential states: clenching and rest. Each of these states send a signal the hand to either clench or unclench.
What are "EEG" signals???
EEG, short for Electroencephalography, is a measurement of electric activity in the brain. Sensors are placed in strategic locations across the scalp in order to measure the electric activity of different regions of the brain. Different regions of the brain have different quantitative responses to stimuli. For example, the occipital lobe has a stronger response to visual stimuli than the other regions. From the EEG measurements, it is possible to make inferences about the mental activity of the subject.
So how do we use them to control a hand?
EEG Data Extraction
The first step in this process is the collection of EEG data. Two sets of data were generated: one of a half hour of "rest" data and one of a half hour of "clench" data. Every second, each of the 14 brain regions takes 128 EEG samples. The raw EEG data is incredibly noisy, with values having no apparent meaning if the data is processed raw. Due to this noise, it was useful to apply a high-pass filter. Additionally, similar EEG values could be nearly identical in the raw data. The data, when raw, is also far too voluminous to use in conjunction with a machine learning technique. For these reasons, it is necessary to extract features, or meta-data, from the raw EEG data. Because we were not looking at any outside stimuli, but only the mental activity of the subject, the EEG values from each electrode were averaged in order to accelerate processing.

----Electrode locations on the scalp----
Feature extraction is arguably the most important step in this process. Choosing features that are important indicators of the mental activity and ignoring features that may have no bearing on the classification allows the machine learning algorithm to better evaluate the classification of the EEG signal. In this project, we extracted 16 features total:
Global Maxima - the highest EEG signal value

Global Minima - the lowest EEG signal value

Number of Local Minima - the number of dips in a signal value

Number of Local Maxima - the number of peaks in a signal value

Standard Deviation - The variance in a signal
X-Axis intercepts - The number of intercepts along the X-axis of a signal.

Theta -- theta band value (4-8 Hz)
Alpha -- alpha band value (8-12 Hz)
Lowbeta -- low-beta value (12-16 Hz)
High_beta -- high-beta value (16-25 Hz)
Gamma -- gamma value (25-45 Hz)
Each of the previously mentioned features is connected to a clenched or unclenched signal in some way: for example, a clenched signal generally has a much higher variance than an unclenched signal. Additionally, clenched signals have a much higher global maxima and a lower global minima than rest signals, with fewer x-axis intercepts than rest. Clenched signals should theoretically have more local minima and maxima, but the number of local minima and maxima between clenched and rest signals were very similar. There also appears to be some correlation between EPOC values and classification, as a higher accuracy was achieved including the EPOC values than without them.
Although looking at just one of these signal features would be inconclusive to determine the correct classification of a signal, by processing all 11 of these signals together, machine learning techniques are able to train and weigh each feature in such a way to generate an accurate binary classification. It is also important to note that there are many, many possible features to extract outside the features that were extracted in this process. Extracting additional features and training on them could lead to improved accuracy or additional classifications. After extraction, the data files shrink by a factor of 128, due to features being extracted from 1 second of data each.
Now that the 11 features are extracted, it is crucial to train a machine learning algorithm on the data. For the purposes of this project, an artificial neural network was used as a classifier. The neural network has 3 layers consisting of 11 input neurons, 6 hidden neurons, and a single final output neuron.
To train the neural network, 3000 data points of "clenched" as well as 3000 data points of "rest" data were used.
In conclusion, the neural network had an accuracy of 97.4% on test data after training. However, simple actions such as movement or, in some cases, speech can drastically effect the output of the classifier. Movement will almost always create a false positive and classify as a clenched output, even if the user is not sending a clenched output. In order to correct this, additional data could be generated of movement while not sending a clenched signal. Training off this data would drastically improve the accuracy during movement. Additionally, training on speech while clenched and unclenched will improve the accuracy in those cases as well.
So how does it all work together?
Data is collected from the EEG EPOC+ headset, and sent to a computer for processing. This could be a raspberry pi or laptop. After the data is processed, and features extracted, the features are fed through the neural network as inputs. Every second, the neural network will produce an output of '1' for clenched, or '-1' for unclenched. After the signal has been classified, the classification is sent to the arduino unit in order to control the servos that control the hand. If it is a clenched signal, the servos rotate, flexing the fingers. If it is a rest signal, the servos rotate to a home position, resting the fingers.
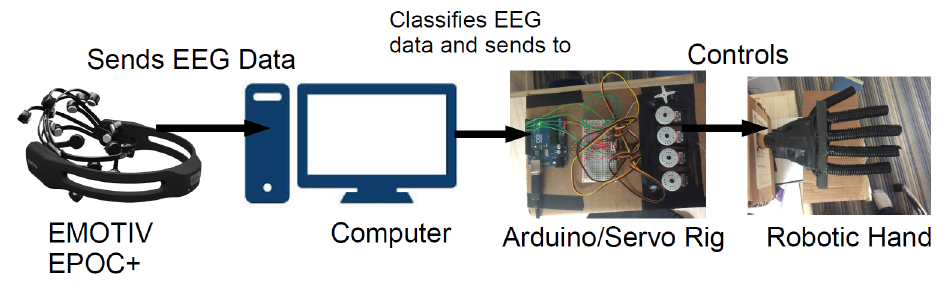
----Visualization of Data Path----